Moving Averages Most literature written on technical analysis, more specifically technical indicators, begins with Moving Averages. The reason for this is simple; they are considered by most analysts the most basic and core trend identifying indicators. As its name would suggest a moving average calculates an average of price range over a specified period. For example, a 10 day moving average gathers the closing prices of each day within the 10 day period, adds the 10 prices together and then of course divides by 10. The term moving implies that as a new day’s closing price is added to the equation, the day that is now 11 days back is dropped from the equation.
The example above outlines what would be considered a Simple Moving Average. There are at least 7 varieties of moving averages, but generally the average Forex trader is focused on just one of the following three: Simple Moving Averages, Exponential Moving Averages, and Weighted Moving Averages.
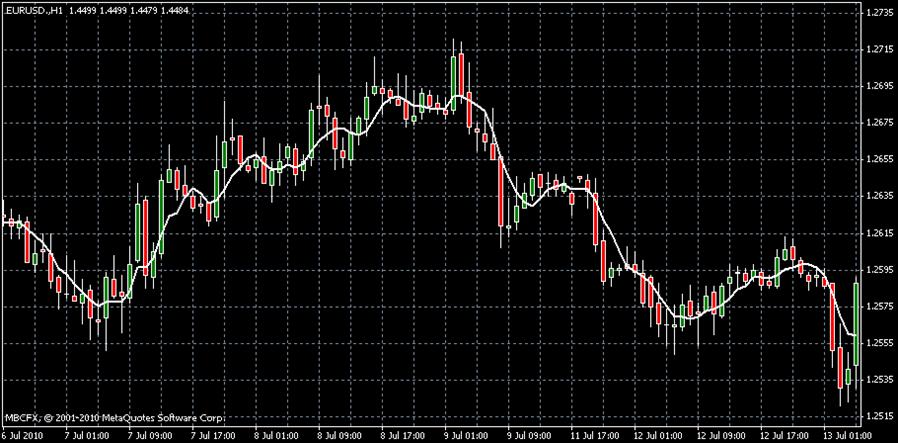
Before examining the various calculations and types of moving averages it is essential that we as traders understand what a moving average is trying to tell us. Its message is really quite simple, and is primarily focused on market expectations. A moving average calculating the last 30 days of prices in the market essentially represents a consensus of price expectations over that 30 day period. The example below shows a moving average line across a basic candlestick chart.
Understanding a moving average is at times as simple as comparing the market’s current price expectations to that of the market’s average price expectations over the time frame that you are viewing. The average gives us a bit of safe zone or a range that traders globally are comfortable trading within. When prices stray from this safe zone or from the moving average line a trader should begin to consider potential entry points into the market. For example, a price that has risen above the moving average line typically implies a market that is becoming more bullish, traders are on the up, and with such will come good opportunities to buy. Just the opposite, when prices begin to fall below moving average lines the market is becoming visibly bearish; traders should thus be looking for opportunities to sell.
Notice the angle of the moving average shown above at various points across the chart. Moving averages not only give traders a much smoother look at the true trend of the market, they also offer keen directional insight found in the angle of the moving average line. Erratic sideways markets tend to be represented by moving average lines that are flat or sideways, whereas markets that are beginning to trend strongly in one direction or another will begin that trend with a very angled moving average line. Remember, it is one thing to look at a completed moving average line and determine at what point would have been an excellent entry into the market, it is another thing to spot the angle of the line as it is developing and at that point wisely enter the market. A true technical analyst is after what the moving average can tell him or her about the coming hours or days of the market, not what the moving average can prove about what should have been done in the past. That said, look for angles!
Simple Moving Averages Calculating simple moving averages is really quite simple (no pun intended). As was outlined in the beginning of this section the sum of all closing prices is divided by the number of days in the equation. With each new day the now oldest day that is no longer a part of the time frame is subsequently dropped from the equation. A simple moving average is considered a lagging indicator. In fact, the simple moving average perhaps epitomizes the meaning of lagging indicator in that its visual data often comes a bit after the fact, and can be hard to act on. Nevertheless, simple moving averages are key to understanding the markets general feel of where the price rage should be trading at, or the safe zone that we referred to earlier. When prices begin to break away from the moving average line in conjunction with a sharply angled moving average line – basic mathematics is predicting a move up or down in the market. The notable down side is that when observing lagging indicators, this prediction often comes too late; thus the reasons for other types of moving averages, averages that more heavily weigh recent data and can offer quicker predictions:
Exponential & Weighted Moving Averages Exponential and weighted moving averages attempt to resolve the issue of lagging directional forecasts. In other words, they often cut to the chase faster, allowing traders to better time the market. This is done by placing greater emphasis on more recent price data. Instead of evenly distributing plotted points of a moving average across all candles in the period, a weighted or exponential moving average puts more emphasis on the most recent data; allowing the angle of the moving average to react more quickly. Theorizing that most recent price data is more important to the immediate future of the market than is older price data is often true, but can certainly be a trader’s demise if he or she is not careful. Trading a heavily weighted 10 day EMA (exponential moving average) and jumping the gun on an initial angle up on the EMA when just 10 to 12 days prior a very strong and long down trend occurred might be a bit naïve. Why? It is simple, Your 10 day EMA is over looking data that is an accurate reflection of recent market sentiment, or price direction. Remember, reading moving averages is about comparing an average view of the market’s recent trends to an actual view of recent price data. In other words, is the market trading within its safe zone, or where its average has been lately? If not, it may be an indication of a new direction or trend, but before you pull the trigger cross check your SMA (simple moving average) and gage an evenly weighted average of the market’s recent history.
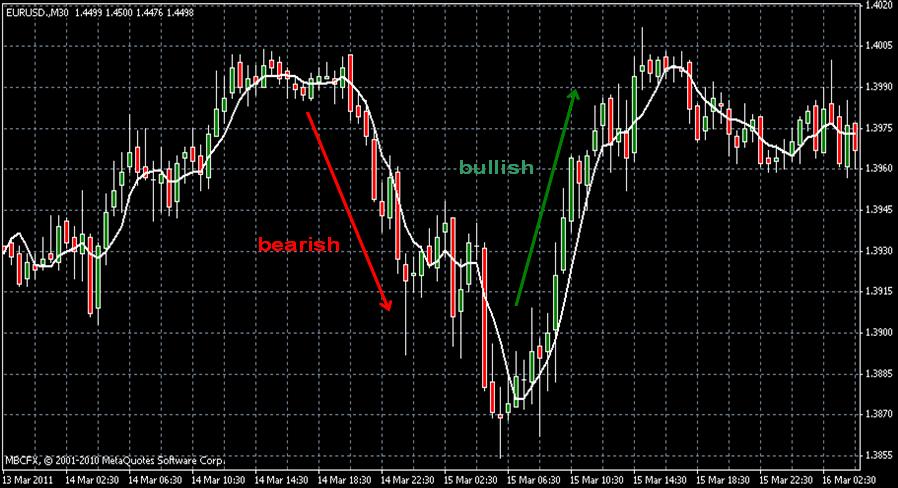
Whether using exponential moving averages, weighted moving averages or simple moving averages the objective does not change. You are looking for an average in which the market has been trading. When new candles push significantly through this average in conjunction with a sharply angled moving average line it is time to consider an entry point. History has proved itself; when prices begin trading above the moving average line the market is becoming bullish and traders should be looking for buy entry points. When prices begin trading below the moving average line the market is becoming bearish and traders should look for an opportunity to sell.
20 Days & the Moving Average Cross There are those who pretend that they understand why the 20 day moving average is such a popular choice of today’s Forex traders. The answer may simply be that the average charting software offers this time frame as a default setting, or it may be that minus the weekends this time frame represents about a month of market activity. Whatever the case may be, an increased number of traders around the world follow this number, and thus theory becomes reality. In other words, why do technical indicators often work as well as they do? Well, market sentiment is everything; remember human beings drive any financial market. If enough human beings believe in the same indicator and the same time frame for that indicator, often there is no better way to go than with the crowd. Market sentiment when shared by the masses most often becomes market reality. That is why an untrained trader often finds him or herself baffled by a price move that does not make any logical sense. But, perhaps this trader was unaware of the fact that after a large and intense move up in the market technical analysts around the world were all looking at the same Fibonacci retracement levels (material for a later course, no need to fret). As such, everyone believes that the market will retrace at the same Fib levels and so everyone begins to sell at the same level, thus pushing the market down; sentiment becomes reality. For this very reason it is imperative that anyone serious about trading the Forex market, or any market for that matter, must first learn the basics of technical analysis. Often technical analysis and market sentiment are one in the same.
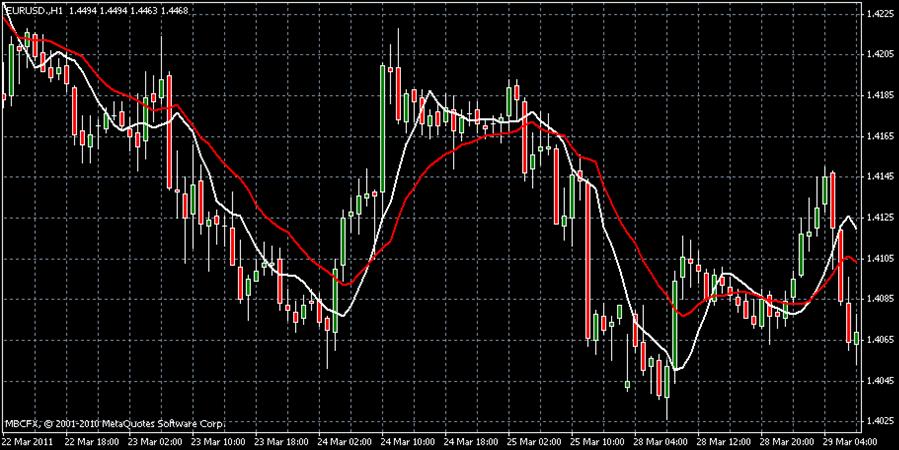
The moving average cross is a tool that should not be overlooked. As can be seen in the above image there are two moving average lines plotted on this chart. The idea is to combine a short term moving average with a long term moving average. For example, a 10 day moving average on top of a 20 day moving average. Of course the shorter moving average period will react more quickly to price direction, whereas the longer moving average period will be represented by a smoother less volatile line. When the two lines cross this is considered an indication of a quickly approaching trend reversal or change in price direction. As always, watch for the angle of the moving average line, particularly the shorter time frame (in this case the 10 day moving average). When lines cross with a sharp angle and an obvious separation from one another nine times out of ten a trader can count on a change in price direction. Do not trust moving average crosses that are represented by lines on top of one another. The two periods might have crossed, but if there is not a sharp angle and a good degree of separation after the cross expect a sideways market for the time being.
When trading moving average crosses follow these rules: when your shorter moving average period crosses the line representing your longer period from the bottom – look for an opportunity to buy. In other words, the market in this situation is most likely poised for a trend upwards. When your shorter moving average period crosses the line representing your longer period from the top – look for an opportunity to sell. The market in this situation is most likely poised for a trend downwards. Take a look at the following chart; notice that the angle of the cross and the separation of the cross are the keys to large changes in direction.
Don’t jump the gun! Often inexperienced traders assume that a moving average cross is a perfect entry at the exact point of lines intersecting. This is usually not the case. Do not be fooled by what may become nothing more than a sideways market. Again, look for sharp angles and an obvious degree of separation between the two lines. Looking back at the image above, notice that the solid trends all have two things in common; the shorter period line has a sharp angle up or down, and the two lines are separated by what would be at least 2 or 3 numbers on a clock. Once this separation is obvious and a few candles have opened higher than the previous (lower than the previous in the case of a downwards trend) the market has shown its true colors. At this point, you should be looking to pull the trigger.

 عربي
عربي Español
 English
 Polski
 Deutsch
 中文(简单)
 中文(簡體)
 Pусский